Internet Service Providers are almost universally despised. They've pushed for the FCC to continue defining 25 Mbps as "high use" broadband, and on top of that they overstate the quality of service they provide. A recently-released map of broadband availability in the US paints a pretty dire picture:

Here in St. Louis—where I guess I should count my lucky stars we have 'high use' broadband available—I have only two options: I can get 'gigabit' cable Internet from Spectrum, or 75 megabit DSL from AT&T.
That's it.
And you're probably thinking, "Gigabit Internet is great, stop complaining!"
But Spectrum's "gigabit" Internet is 930 megabits down—in ideal conditions—but only 40 megabits up. And that's the highest plan that costs about $150 a month!
Some would die for those speeds (see the map above), but much of the world is better off. And are you really getting the speeds you pay for? You probably don't know.
Well, I do, thanks to a $35 Raspberry Pi! And you don't even need a Pi, you could run the software I use on any computer. I just like having a dedicated computer to run all my Internet connection tools, so it's easy to backup or replace, and it doesn't get bogged down.
Video
I have a video that goes along with this blog post, and it's embedded below; skip past it if you prefer reading over viewing.
My Internet Pi
This is my "Internet Pi" (hostname geerli.net):
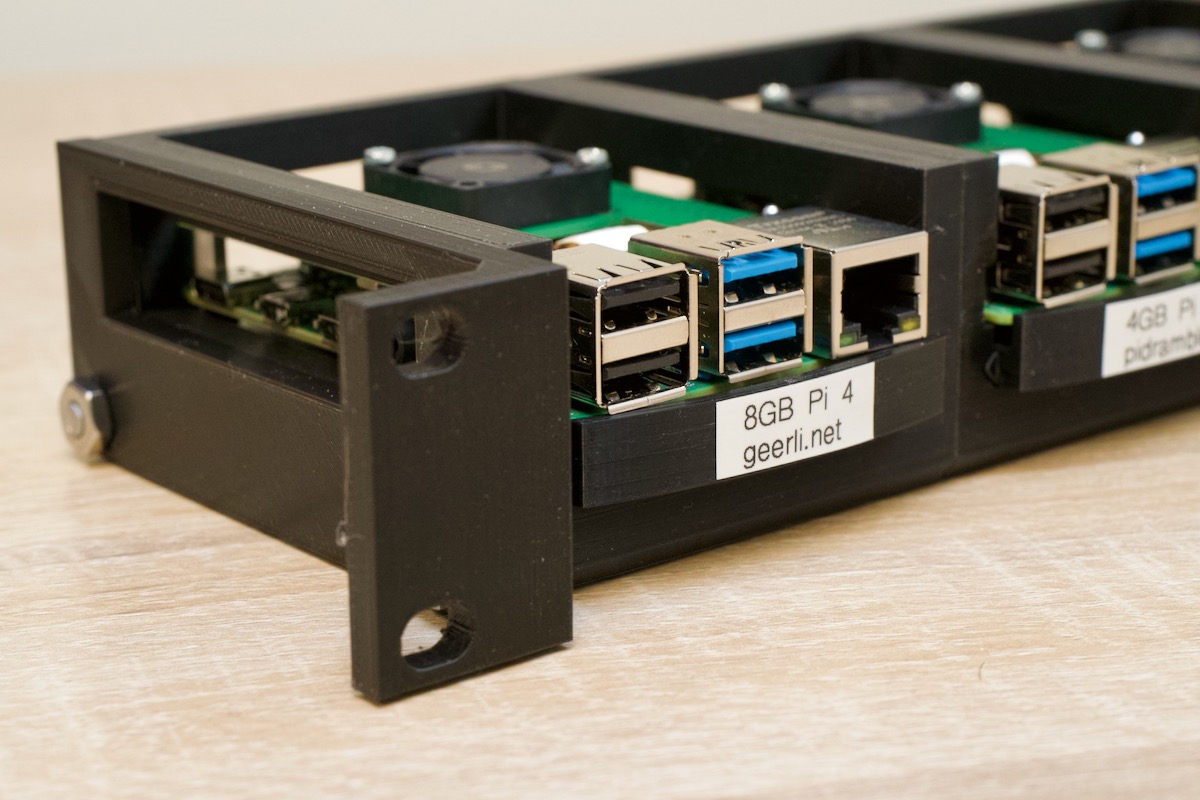
I have it installed in a rack (here's a video on the Pi rack), but it could just as easily be on my desk, or sitting by my Internet router.
The most important thing for measuring a network connection is that it's wired. WiFi, especially on the Pi, fluctuates quite a bit and is terrible for monitoring anything besides maybe WiFi signal strength.
The Internet Pi runs Pi-hole for DNS privacy and ad-blocking, and Prometheus and Grafana to provide Internet connection monitoring dashboards.
Having a Pi monitoring my Internet continuously makes it easy to see trends over time, or confirm outages. If you just spot check by running a Speedtest every now and then, you don't have much data to go on.
Setting up Internet Pi
I built the free and open source internet-pi project on GitHub. It's simple to set up, and you can choose which parts of the platform you want to use.
I set up my Internet Pi from another computer, but you could also run the Internet Pi playbook on the Pi itself. Following the install instructions, you need to have a Pi set up with Raspberry Pi OS running on your network, and be able to SSH into the Pi.
Here are the steps to get it going:
- Make sure you have Ansible installed:
- (If
pip3is not installed)sudo apt-get install -y python3-pip pip3 install ansible
- (If
- Download the internet-pi repository to your computer:
git clone https://github.com/geerlingguy/internet-pi.git && cd internet-pi - Install the Ansible Galaxy content that's required to make the playbook work:
ansible-galaxy install -r requirements.yml - Make copies of the
example.inventory.iniandexample.config.ymlfiles (dropping theexample.from the filenames) and modify them for your own needs - Run the playbook:
ansible-playbook main.yml
The playbook installs all the tools you choose in your configuration file, and once that's done, you should be able to access your Pi's IP address in a web browser to see Pi-hole, or visit the IP address with the port :3030 on the end to see the Grafana dashboards.
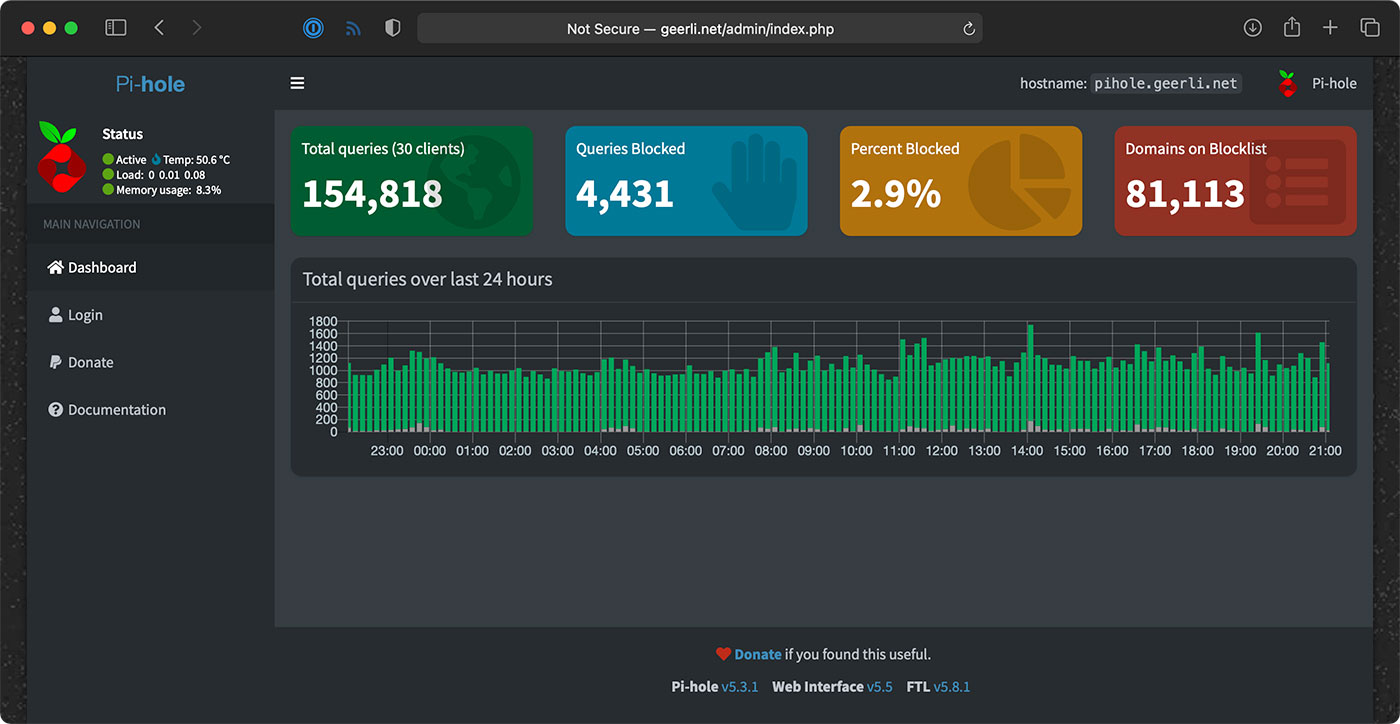
Setting up Pi-hole
If you wanna use Pi-hole as your home network's DNS server, you should configure your router to advertise the Pi's IP address as the primary DNS server for your whole home network. For extra redundancy, you could actually configure two Pis running Pi-hole, but that's a topic for another post!
But the great thing is, that allows you to see all the DNS requests your devices are making, and make sure (for the most part) things like so-called 'smart' TVs don't send tons of information to advertisers.
Pi-hole is a great first line of defense for your Internet privacy, at least at home, and it even has some other neat tools like a simple DNS server, if you want to use them.
Internet monitoring
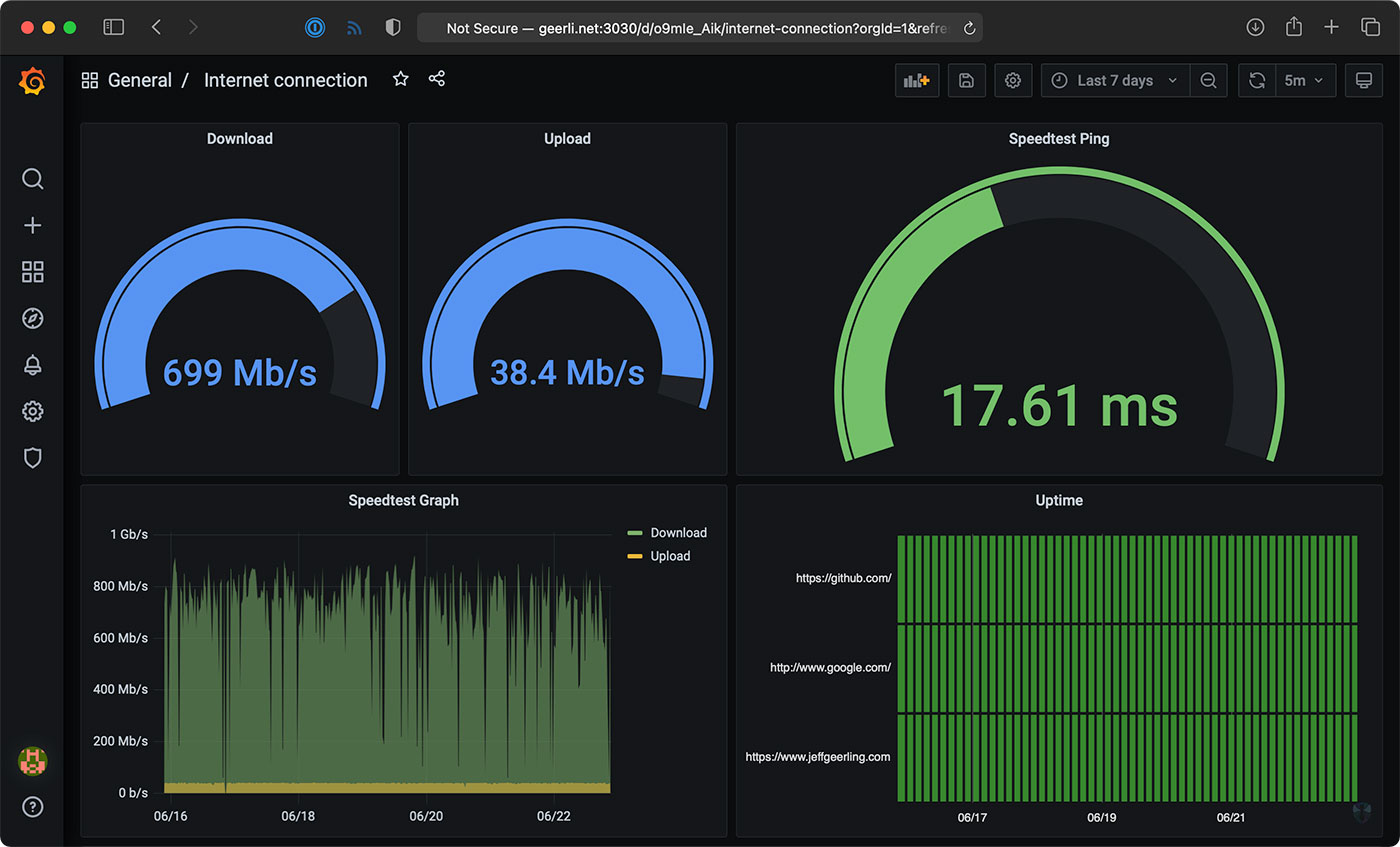
The Internet monitoring dashboard is automatically configured for you, but it can take up to an hour before you start seeing data.
In my case, it's been running for a couple months, so I can see the Internet connection for the past day, week, or even longer!
The monitoring configuration runs one container that connects to Speedtest.net. Every 30 minutes or so, another container running Prometheus tells the first container to run a speed test.
NOTE: If you run this monitoring on your own network, be aware that these Speedtest.net checks will consume a good amount of data, especially if you run them more frequently. If you have data caps and want to use this monitoring solution, make sure to modify the check interval so you don't get an unexpected overage. ISPs, gotta love 'em!
It stores that data on the Pi, and the Grafana dashboard displays it over time. There's another service that does simple checks on websites you can configure for uptime and HTTP request timing stats—those lightweight checks are performed every few seconds, to give a detailed view when there is more latency in your Internet connection.
One thing I found interesting was my Cable internet connection—which is supposed to be one 930 Mbps—is only really about 700 Mbps on average.
Upload speeds are more consistent, so I begrudgingly pay for this high-tier plan... But I'd be a lot happier with 50 or 100 Mbps of asymmetric data, since I'm not downloading terabytes of files every day.
Starlink monitoring
The main reason I set this stuff up was to compare my Gigabit Cable Internet to SpaceX's Starlink Internet.
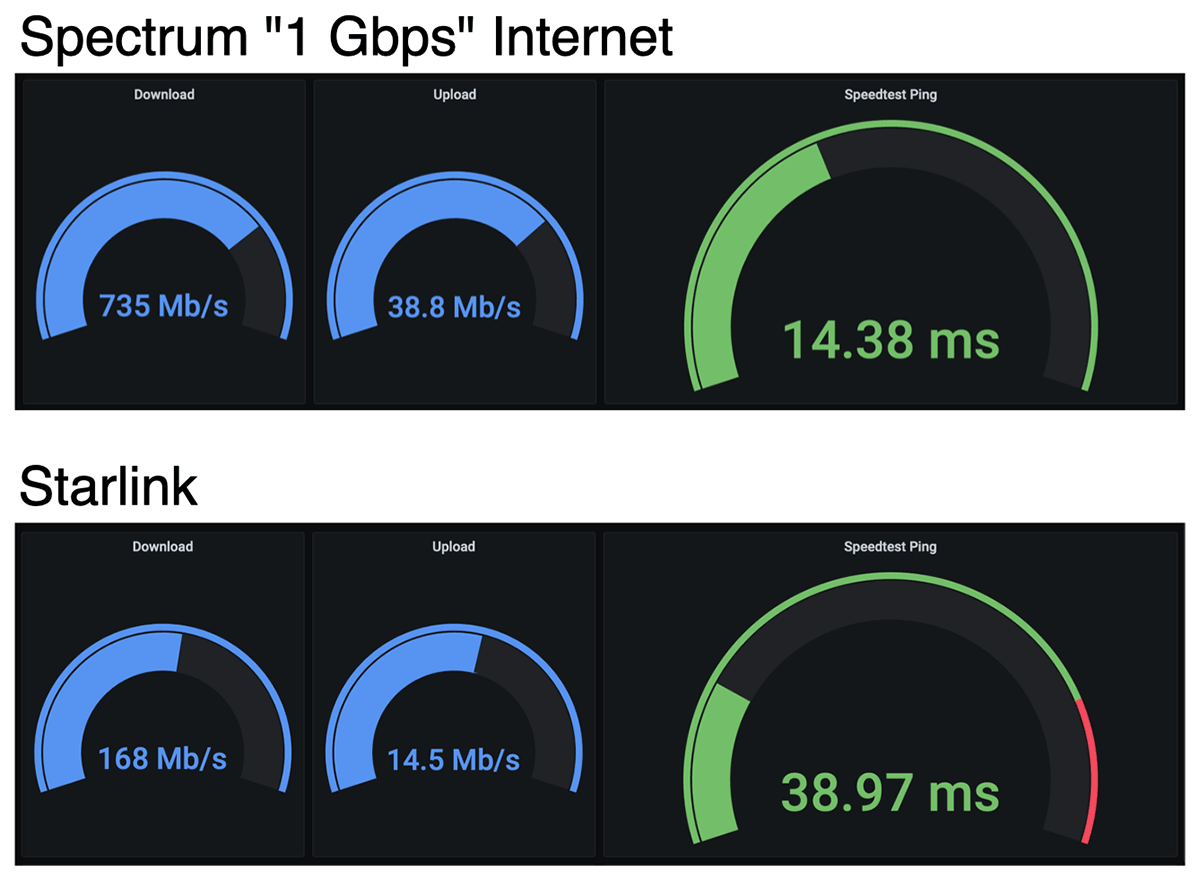
I'll get more into Starlink in a future review, but it looks like on average, when it has a stable connection, I get over 150 Mbps down, and 15 Mbps up, with 40 milliseconds of latency.
Those numbers are less than my Cable ISP; but Starlink also costs less—it's $99/month. And Starlink is also beaming the Internet through satellites up in the sky! For someone who doesn't have a fast Cable option (like rural customers), that's a mind-blowing upgrade from dial-up speeds.
But I mentioned earlier, there's also a Starlink-specific dashboard that gives all the details you'd normally find in the Starlink App.
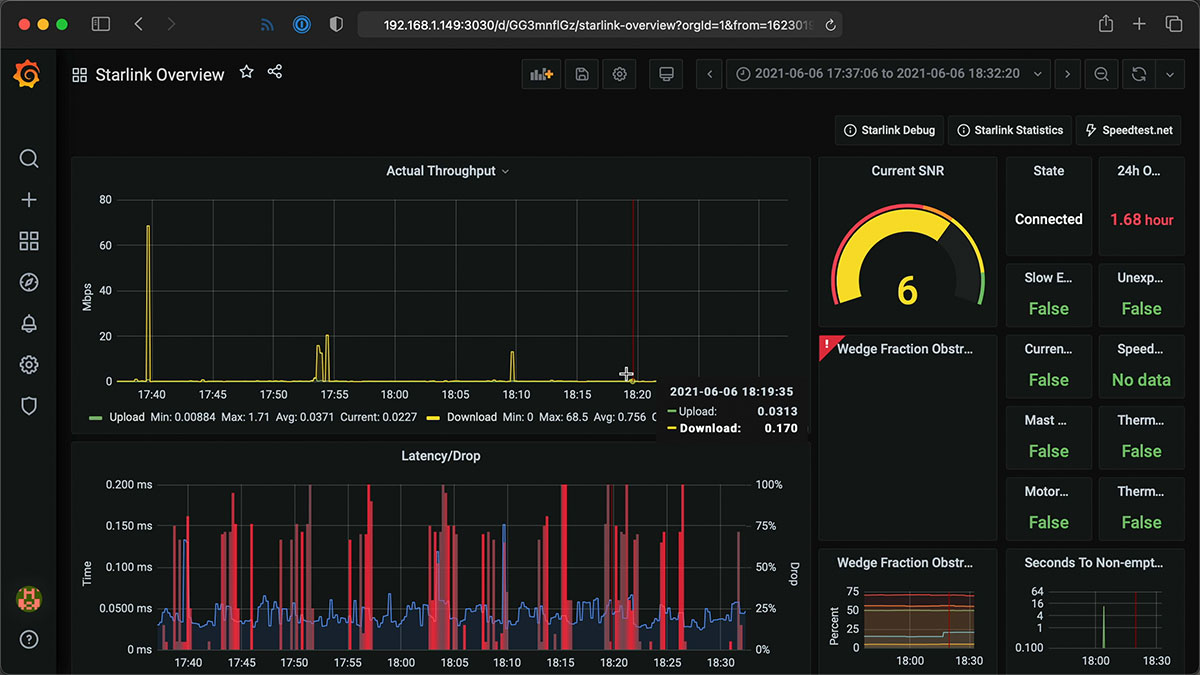
I haven't been actively using the Starlink connection today, so it's a little barren, but it gives a ton of detail, and I'd like to thank Daniel Willcocks (DanOpsTech) for making this possible; I'm using his Docker image and dashboard, and he even adjusted it to work on the Raspberry Pi after I asked about it!
Power monitoring
I also monitor Starlink's power consumption using a Shelly Plug US and a custom Shelly Plug Prometheus exporter I wrote:
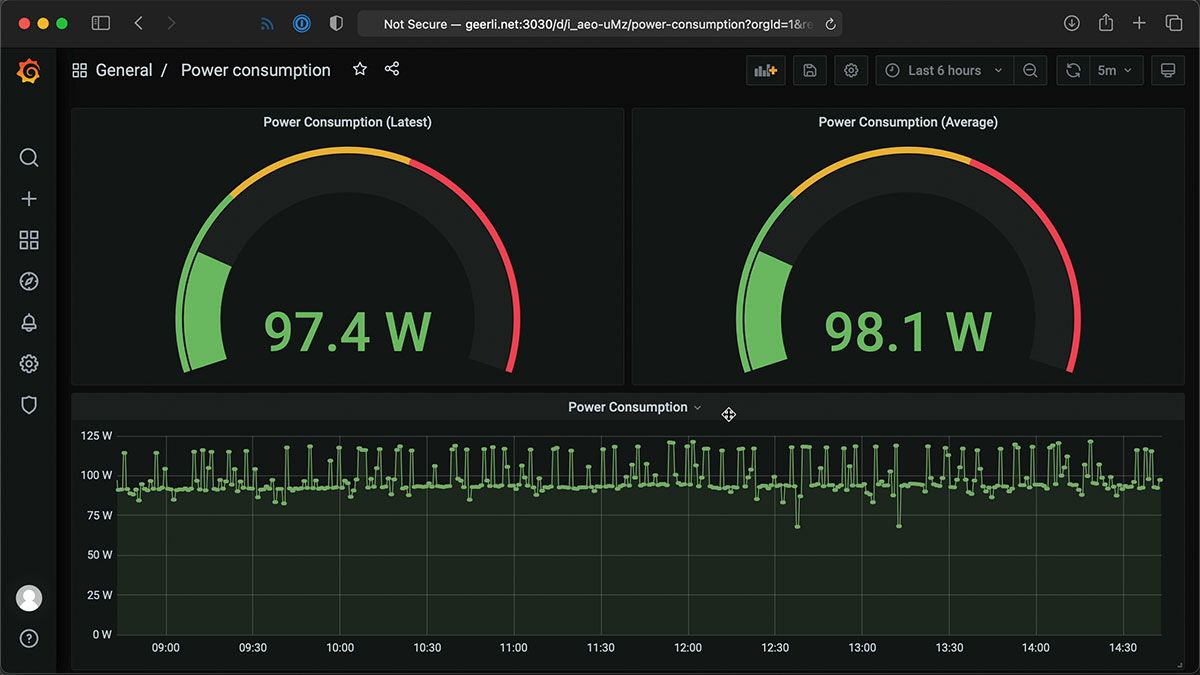
Starlink's dish and router use a lot of power (more than you might expect)—but I'll discuss more about that in my Starlink review coming soon! I have a blog post with more about how I set up the Shelly Plug power monitoring.
Conclusion
Now I know exactly how much my ISP is fleecing me for Internet. In Spectrum's case, it looks like they're only giving me about 3/4ths of what I pay for.
I wish I could just pay them $110 a month instead of $150, but if I did that, they'd cancel my service!
I'd like to thank Max Andersen for the original inspiration for the original monitoring configuration, the developers behind Pi-hole for making it free and open source, and especially Miguel who maintains the speedtest exporter, for his help getting some bugs fixed!
Comments
I tried to install this 4 times by now.
First I tried installing it on Bookworm. Errors where countless.
So I installed Bullseye. That was a lot better.
I did install plain Bullseye on a RPI 4/8gb.
And then started on this project. Many errors further, which I could resolve, I run into:
ansible-playbook main.yml
It gives me these errors:
ERROR! couldn't resolve module/action 'community.docker.docker_compose_v2'. This often indicates a misspelling, missing collection, or incorrect module path.
The error appears to be in '/home/myname/internet-pi/tasks/handlers.yml': line 2, column 3, but may
be elsewhere in the file depending on the exact syntax problem.
The offending line appears to be:
---
- name: Restart pi-hole
^ here
So I think, I need Docker. But I nowhere read anything about installing docker, not even how.
It took me days to get this far, and now I am stuck. How do I get further?
Thanks ahead.
RobB
I tried my best as a Windows user, but managed it all until ansible-playbook main.yml
And then I got this error:
ERROR! couldn't resolve module/action 'community.docker.docker_compose_v2'. This often indicates a misspelling, missing collection, or incorrect module path.
The error appears to be in '/home/Meester/internet-pi/tasks/handlers.yml': line 2, column 3, but may
be elsewhere in the file depending on the exact syntax problem.
The offending line appears to be:
---
- name: Restart pi-hole
I looked into the code, but I do not see what could be wrong.
I am running Pi4/8GB Bullseye/64
And installed nothing sofar, except for the : sudo apt install network-manager network-manager-gnome In order to get the Network icon to work in the GUI/
Somebody an idea how to fix this?
Would happyly receive an answer.
RobB
For anyone else having issues with Debian Bullseye, here are the commands I used to get this to work on an RPi4 8GB:
sudo apt-get install -y python3-pip
sudo rm -rf /usr/lib/python3.11/EXTERNALLY-MANAGED
sudo pip3 install ansible
export PATH=$PATH:~/.local/bin
sudo apt-get install git
git clone https://github.com/geerlingguy/internet-pi.git && cd internet-pi
ansible-galaxy install -r requirements.yml
sudo usermod -aG docker $USER
ansible-playbook main.yml
About 15 minutes later it finished configuration and I was able to login to Grafana at http://ipaddress:3030 (admin/admin, unless you configured something else)
Hope that helps.
Hi Jeff,
I just want to say I love this script, but I recently updated to 24.04 (fresh install) on a rpi v4 8gb.
For some reason pihole is not found when I try to change the password.
pihole -a -p
I get the following:
Command 'pihole' not found, did you mean:
The only way seems to be changing it in the config file and run the playbook again.
Is there something i am possible doing wrong?
Thank you again for a great script and I also love your youtube channel.